
Chances are, if you teach third through fifth grades, the term “line plots” has become a part of your vocabulary. If you give standardized tests, you’ve probably realized that test makers love them! Unfortunately, many textbooks and other resources really don’t seem to provide many rich and meaningful experiences with line plots. Most activities are simple “create the plot” activities or are sets of questions that ask very basic information about the plots. I wanted to find a way to make line plots more meaningful to my students, so I started by thinking of the following questions:
1. When are line plots meaningful?
2. What misconceptions do students have regarding line plots?
I started by thinking of real-world situations where we could explore line plots in a fun way (knowing that our test and our standards want students to be able to plot data with both whole numbers and fractions). I know my students love to move and love to be engaged and busy–so I set to work brainstorming. I know that our current unit of measurement was a GREAT place to start–we could tie in our metric conversions and really make this a great learning experience.
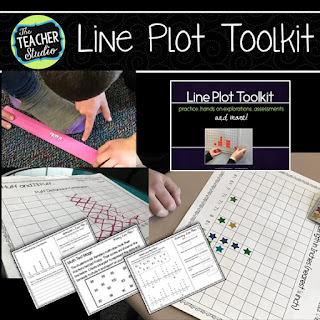
I decided to set up some stations where we would collect data…we measured the length of our feet to the nearest 1/2 inch. We measured our wrist circumference to the nearest 1/2 cm. We measured our standing broad jump to the nearest 1/4 foot. We measured how far we could blow a cotton ball with a straw to the nearest cm.


At each station, I made a big line plot for students to add data to…and then we got ready to roll! We met together to talk about some key measuring factors and expectations and reviewed how to measure to fractions of units. We talked about sportsmanship (positivity only!), rule following, and then I asked the question, “How can we make sure we work with as much precision as possible?”

We had a great discussion about consistency, about coming to an agreement about techniques (left foot or right foot? Shoes on or off? Standing or sitting?) so we could make sure we were as fair and scientific as possible. Once all the questions were answered, we were off! It was actually a great piggyback discussion to our science work from a few weeks back about keeping things “constant”! At each station, I had students record in a different way…just a marker to make an “X” at one, orange sticky dots at one, and stickers at another. I want them to realize that HOW the data is recorded isn’t as important as the data itself.

I had a blast walking around the stations, talking to them, asking them questions, helping them make predictions, and watching and reminding students to record their data on the line plots. When we were finished, it was time to bring the plots up to the easel and analyze them!
We had some amazing discussions…we talked about what data we COULD find…what data we could NOT find…we talked about the term “outlier” and discussed all the reasons a data point (or more) might not fit the rest of the plot–from operator error to just unusual data! I started to ask them trickier questions…like if all the students who jumped 5 1/4 feet added their jumps together, how far would it be? One student asked a question that brought me back to my questions from the beginning–why are line plots meaningful (I think the students bought into that!) and then the idea of misconceptions–and I realized that not all my students realized a very key thing about line plots–that every mark on the plot represents one “vote” or one “person” or one piece of data. It seemed so obvious to me…but it wasn’t to all. It was an easy fix–and then I found my second misconception–the idea of “most”.
On a line plot, you can ask two big question related to “most”…which category had the most “votes” (the “winner”…the tallest bar in a bar graph, etc) but also the “most” might refer to the biggest category…the biggest foot, the longest jump, and so on. We had quite the discussion about how important it is to read the question and to think about what is being asked; the greatest “jump” is very different than which CATEGORY got the greatest number of tallies.
I think we are ready to try some trickier problems…so I am ready to sprinkle some line plot practice in over the next weeks to keep these ideas fresh in their minds before we do our state testing in April. I think they’ll have a much deeper understanding now!