One thing that I know to be true is that students need to learn to read, do math, and be critical thinkers. Quality graphing lessons combine all three! Unfortunately, what our textbooks often do is present students with a graph and ask them low-level, “right there” questions. There is a time and a place for that—but I think our students can do so much more. After all, we want students to learn to think critically and apply that skill to ANY graph or chart they encounter, right? We don’t want to create a group of learners who merely want to fill in the blank.
I have found some things that have worked well to get students thinking about graphs in more sophisticated ways. Let’s look at a few!
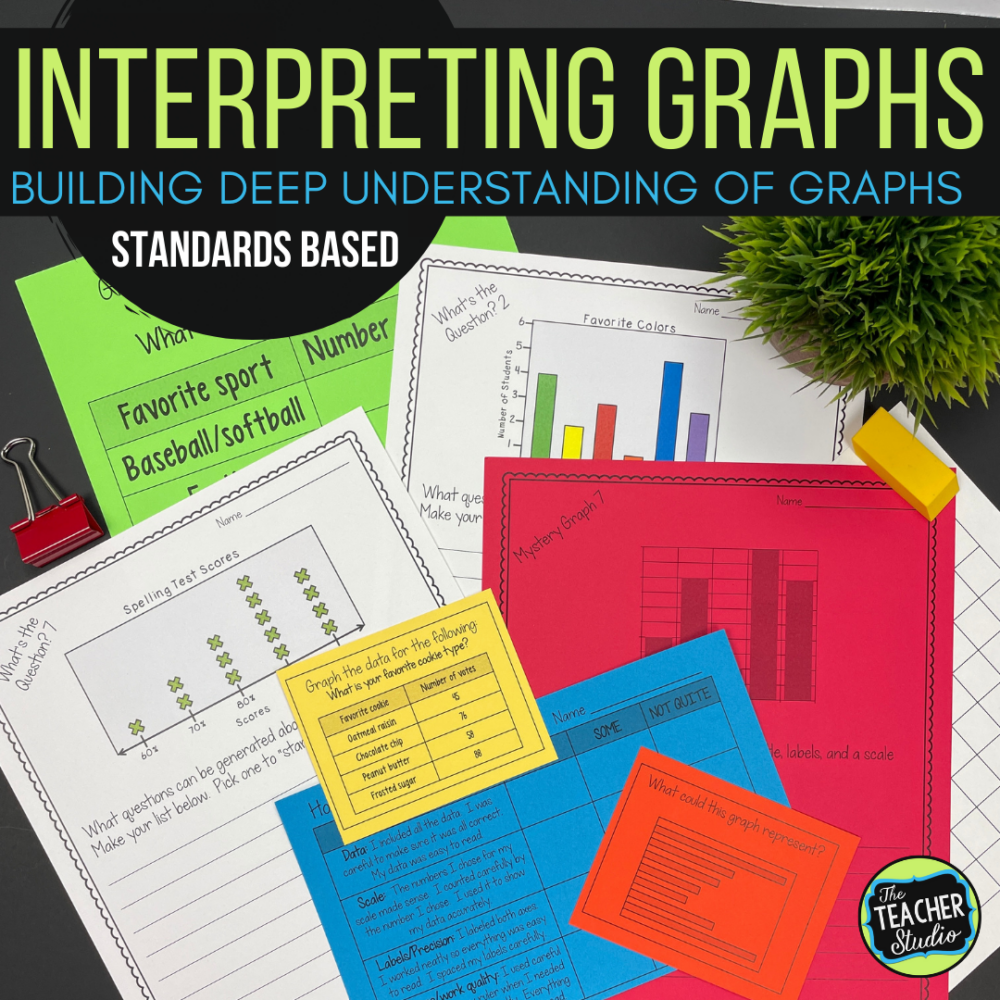
Mystery Graphing Lessons
One activity I like to do is called “Mystery Graphs”! These are graphs that are “empty”—no titles, no labels, nothing. They are geared toward getting students thinking about what the data looks like and what the title/topic COULD be. What great ways to start math discussions!
Picture exposing students to different graphs—pie, bar, and line– that have no title, labels, scales, or anything! It is a “mystery” as to what they are representing—and there are NO right answers.
Why Use Mystery Graphs?
The point is to get students talking and thinking about math, data, and limitless possibilities! Rather than answer a simple question about a graph, these mystery graphs force students to look at the patterns (What kind of data might we find on a line graph that has a steep incline? What kind of data might we represent on a pie chart that has 7 different parts–maybe the days of the week? You get the picture.)
How do you use mystery graphs? Get creative! Whether you have students in pairs or small groups to work together, having students work alone and then sharing as a whole class, providing as enrichment, or using in math workshop—help students tap into their number sense, reasoning, and problem solving by letting THEM think about math instead of doing the thinking for them!
These are a great way to get students to understand that data needs to make sense, that we can look for patterns and trends, and that graphs are meant to convey important information in a way that makes sense to the “reader”.
What’s the Question?
Of course, we also know that we need students to study graphs that ARE complete! However, this still doesn’t mean we just have them fill in low-level answers to questions.
We need students to look at a representation of data and generate the questions that could be answered by the graph/chart. This is a far more constructivist way for students to look at data—rather than hunting for the answer to a specific questions, they can generate lists of their OWN questions that can be answered by the graph.
Why is this important?
It asks students to look at graphs in more detail, to study them from different perspectives, and to be able to show their depth of understanding. It also helps teachers see how they can further push students’ thinking rather than just hunt to find a single answer.
I would encourage you to have students study graphs collaboratively to give them the chance to dialogue about the math and other content and to push each other’s thinking. This also gives your class a great forum for quality discussion and sharing as well.
Creating Our Own Graphs
The best way to really master the idea of graphing is to make your own graphs! This, of course, can be done at different levels. You can use the data sets that you provide your students. You can provide students with survey questions where they can interview classmates or others. They can even create their own questions. Let students get creative!
Consider having checklists and/or rubrics that students can refer to as they work on creating their own graphs. This will help them know what is expected and to be able to self-assess their work.
Want Some Help with Graphing Lessons?
Graphing is a skill that is sometimes overlooked. At times we find some graphing work in math series. Sometimes we find some work in social studies curricula. Often, we rely on a little luck to find graphing activities!
Because of this, I created a resource that can help you out if you are like me–no real activities at all in district-provided resources! Whether you want to do a graphing “boot camp” where you immerse your students in graphing work for a week or two (I know a lot of teachers like to teach graphing at the beginning of the year) or want to sprinkle graphing in throughout the year, I have created a bunch of activities that might help you out.
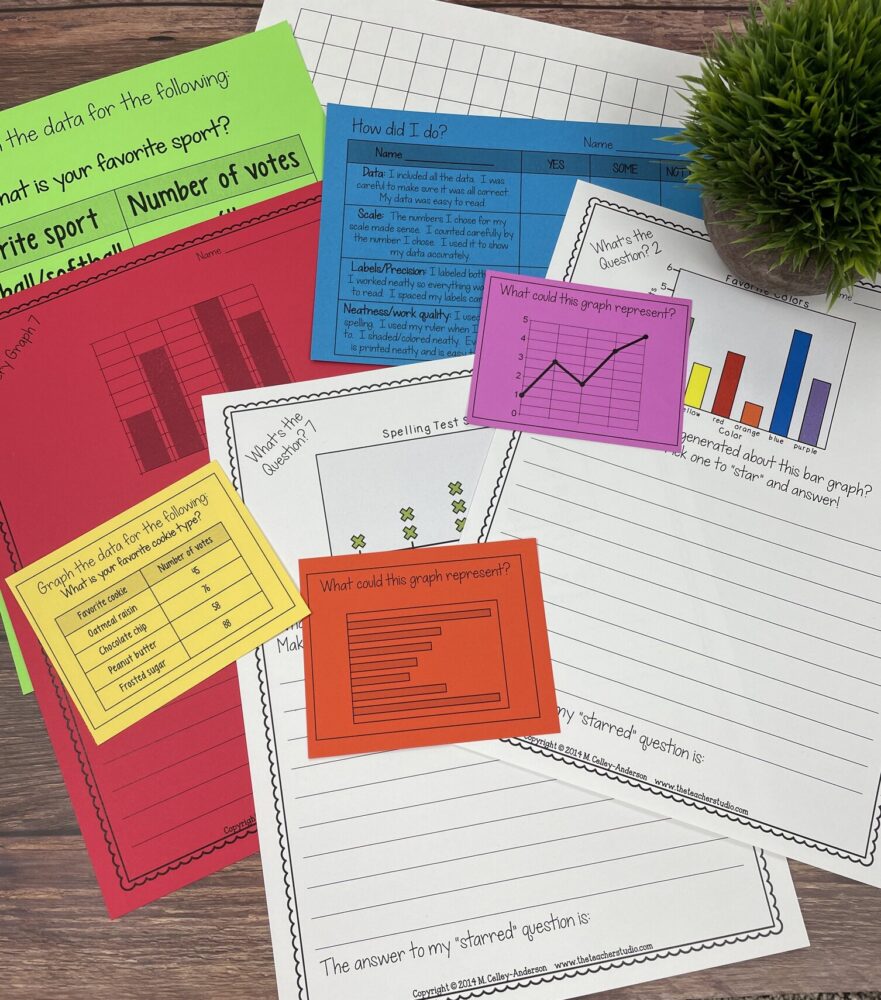
CLICK HERE or the image below to get graphing activities of all types–mystery graphs, “What’s the Question” graphs, and even everything you need to help your students create their own graphs. Need a rubric? No problem! I created that too!
You can print these different activities or project them. I made them clippable as well so students can glue the “mini” graphs right into a notebook or onto paper. I hope you find these useful and meaningful!
Interested in learning more about line plots? Check out THIS POST or THIS POST for ideas!