If you teach upper elementary school math, you are probably familiar with line plots. If you have been alive even HALF as long as I have, you probably didn’t study these little buggers when you were in elementary school. So why DO we teach line plots now?
Simple and Visual
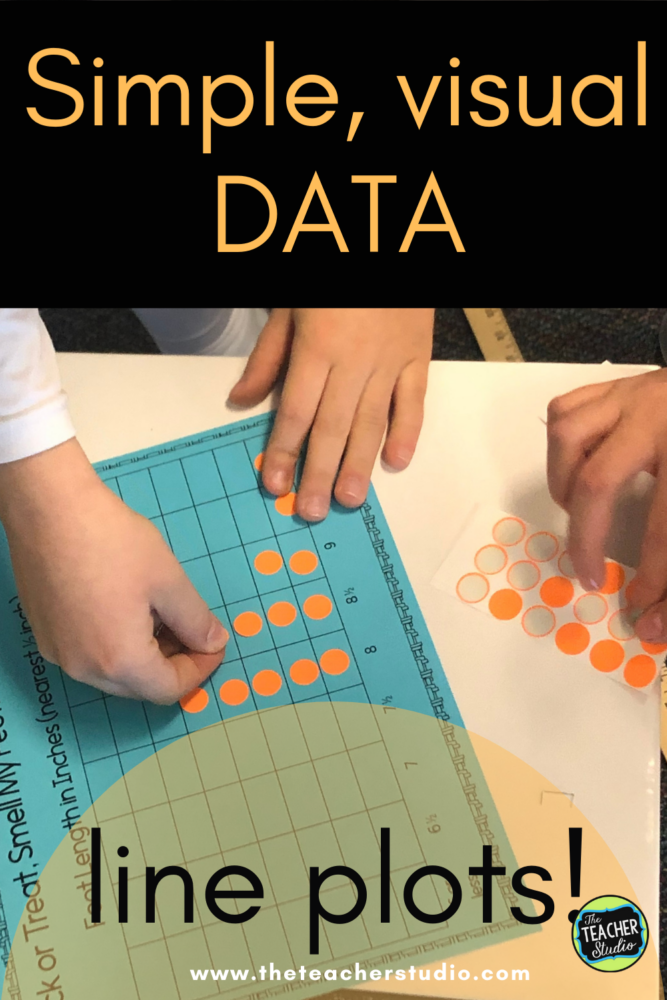
As students advance through the grades, they will be asked to explore more and more sophisticated graphs and charts. From kindergarten on, students build and interpret simple pictographs and bar graphs. Line plots make a connection between those first graphs and the more advanced concepts that lie ahead.
Graphs, by nature, are visual. Line plots allow us to represent data in a simple way–but with a vast range of numbers and data points. We can craft them without fancy tools or even graph paper. Simply start with a simple number line and build up! When we first introduce them, using whole numbers is the way to go. As students learn to navigate the tool, we can make our numbers larger or even use fractions and mixed numbers.
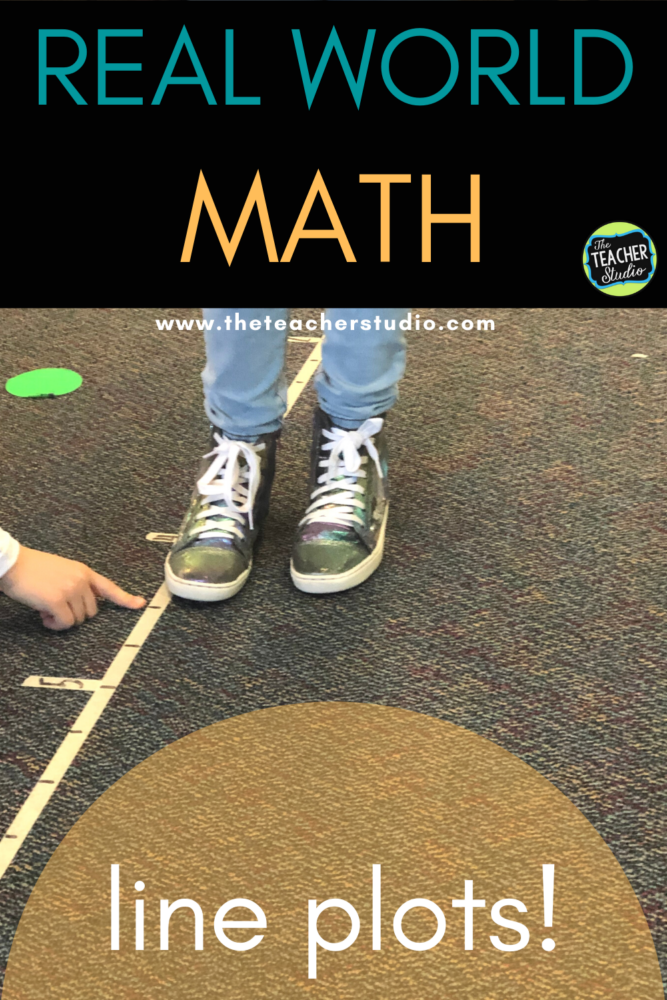
Real-World Math
 Like all math concepts, we want students to realize that in the “real world”, we USE math. Math is far more than just filling in a workbook page! By showing that we can represent real-life events with line plots, students can start to look for trends, notice patterns, and draw conclusions. Making line plots for rainfall…or the length of snakes…or the number of problems correct on a spelling test help students see that we can use data to make decisions. If a graph shows that the majority of people wear shoes between size 6 and size 9.5, what do shoe stores do with that information? If it snows more than 3 inches most days in January, who cares about that data? Getting students to realize that math MATTERS, and that graphs are one way to study data is key.
Line Plots: Studying Data
The beauty of these graphs is that they allow us to ask a variety of increasingly sophisticated questions with relatively simple data. When we first begin teaching line plots, we can ask the most simple questions.
- What had the most?
- What had the least?
- How many ______________________ picked _______________?
- How many ___________________ are there in all?
But as students grow accustomed to working with line plots, we can start asking more in-depth questions.
- What is the total length of the three smallest __________________?
- If each _____________ doubled, what would the highest amount be now?
- What would happen if each _______________ grew 1/4 inch?
- What is the difference between the greatest and least?
And, of course, as the numbers get larger and we start to incorporate fractions, the math gets more challenging. Unfortunately, we sometimes forget to move into the more sophisticated questions, and many times our math programs and workbooks only scratch the surface.
Taking These Graphs to the Next Level
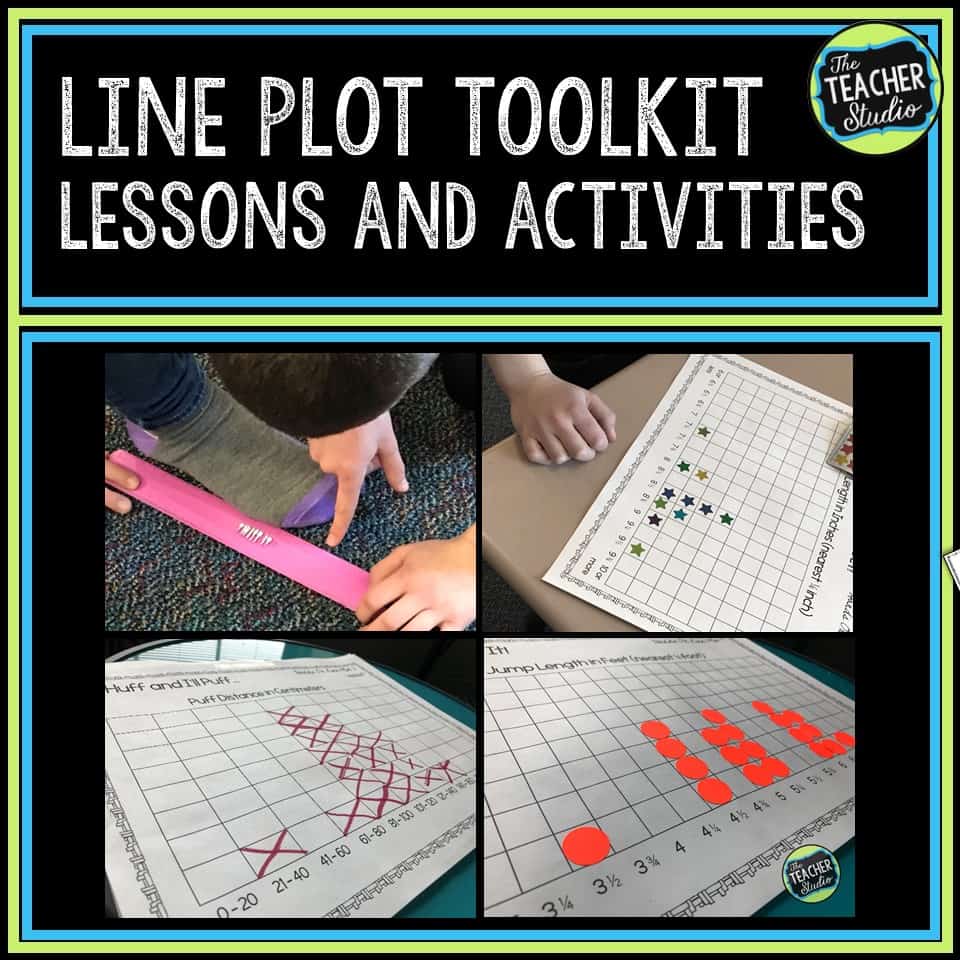
I wanted far more for my students than the simple work with line plots provided to me, so I worked to create my own. From interpreting line plots to building our own, I really wanted my students to have rich mathematical experiences. If you want to see more of what we did, you can check out THIS BLOG POST for some of our hands-on fun!
If you want to see the actual line plot work we do, you can CLICK HERE or the image below. I want my students not just reading line plots but making them as well. I want them asking questions about them and thinking deeply. This resource might be able to help you as it helped me–and it’s low ink and low prep! It includes all my ‘hands on” line plot activities, a ton of practice pages, assessments, and so much more!